Setting up SYCL™ development with oneAPI™, DPC++ and Visual Studio® Code on Ubuntu
01 March 2023
This guide is part 3 of a three part guide. The previous two guides in the series are:
- Guide 1(Part 1)- Debugging SYCL™ code with DPC++ and Visual Studio® Code
- Guide 1(Part 2)- Setting up Visual Studio Code on Ubuntu for C++ development
- Guide 1(Part 3)- Setting up SYCL™ development with oneAPI™, DPC++ and Visual Studio® Code on Ubuntu
This guide will help you to set up your Ubuntu machine so that you can write C++ and SYCL code, compile it using the DPC++ compiler and debug it in the Visual Studio Code IDE.
From within the application Visual Studio Code open up the Extensions panel and search for available Intel oneAPI extensions. In turn, select the following Intel’s oneAPI extensions and install:
- Code Sample Browser for Intel oneAPI Toolkits
- Analysis Configurator for Intel oneAPI Toolkits
- Environment Configurator for Intel oneAPI Toolkits
Prepare a Visual Studio Code C/C++ project to become a DPC++ project
Using the standard C/C++ Helloworld project from the Guide 1 Part 2 as a model, we will create another C/C++ project that takes code from a simple Intel oneAPI program example and configure it to use Microsoft’s C/C++ extension’s build and debug configuration system (removing any previous CMake or similar systems). The project’s various configuration files will be edited to use the Intel’s icpx compiler and gdb-oneapi debugger instead. The project will compiler and enable debugging in the same way as we did with the Helloworld project.
For this example, we will use Intel’s code example Simple Add. This example demonstrates how a simple Helloworld equivalent DPC++ program can produce the same results using two different SYCL memory models. Inside that project it has two .cpp files, one for each model.
Steps to make a DPC++ equivalent C/C++ project:
- Create a new project directory folder. For this example, we will call it VSCodeDpcppSimpleAdd.
- Create two project’s sub-directories called bin and src.
- Copy both the oneAPI simple-add .cpp files to the src directory.
- Open a terminal window and go to the new top project directory folder.
- To get Visual Studio Code to form a new C/C++ project for this folder, type in a terminal window
code .. - In the Visual Studio Code Explorer pane select one of the .cpp files.
- Visual Studio Code may prompt you with a popup wanting you to configure IntelliSense. IntelliSense settings are held in the c_cpp_properties.json file. It will create this file for you. If it does not, then use the command palette (ctrl+shift+p) and type c/c++: edit configurations and choose it.
- Edit the c_cpp_properties.json file and replace the necessary options with those shown in figure 10.
- Select one of the .cpp files and from main menu select Terminal→Configure task….
- From the drop list of compilers choose the Intel compiler listed, i.e. /opt/…/icpx. A new task.json file is created by Visual Studio Code.
- Edit the task.json file so that it contains the four build configurations as shown in figure 11a, 11b, 11c and 11d. These are four types of executable tasks. Two programs each with a release and debug configuration.
- We are using environmental variables to provide the names of the four executables. Make a settings.json as shown in figure 12.
- Test all four build configurations compile cleanly. Use keys ctrl+shift+b and choose each configuration in turn builds.
- Open a terminal window or use Visual Studio Code’s terminal window and execute the four binaries in the project’s bin directory.
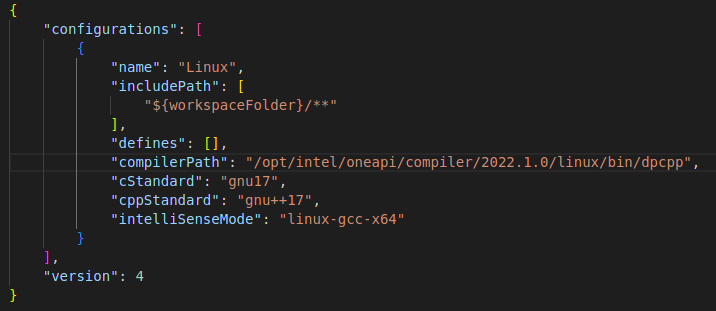
Figure 10: DPC++ configured IntelliSense file c_cpp_properties.json
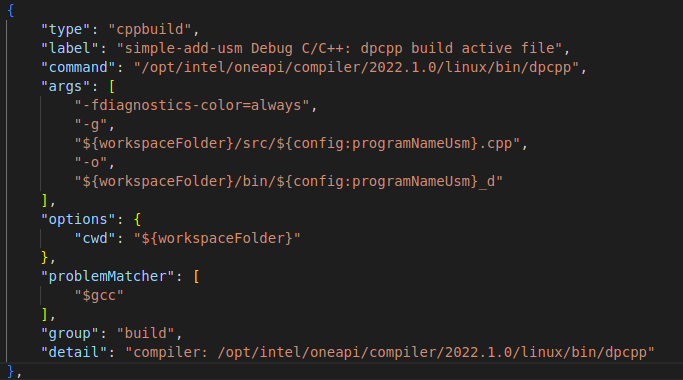
Figure 11a: DPC++ debug build task for simple-add-usm
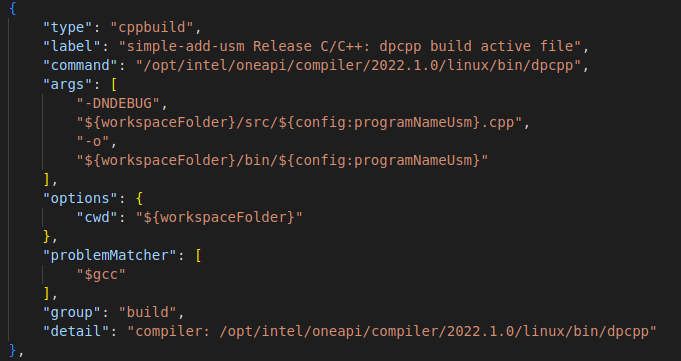
Figure 11b: DPC++ release build task for simple-add-usm
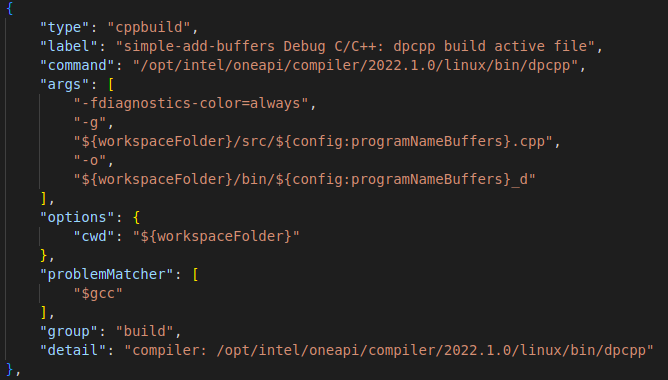
Figure 11c: DPC++ debug build task for simple-add-buffer
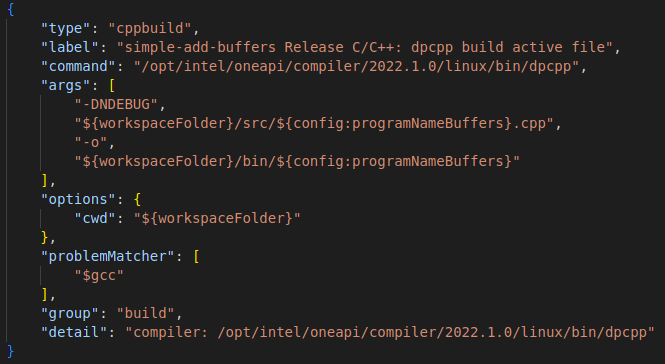
Figure 11d: DPC++ release build task for simple-add-buffer
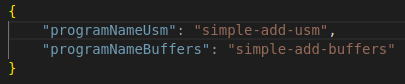
Figure 12: Project’s environment variables definition file settings.json
Prepare a Visual Studio Code DPC++ project to debug a program
Having verified all four variations of the example compile and execute, the debug session configurations can now be added to the project.
Steps to add the debug configurations to the launch.json file:
- In the Explorer window select the simple-add-usm.cpp file.
- From the command palette type ‘c/c++: Add debug configuration’ and select the command, choose the simple-add-usm debug from the list.
- Edit the new launch.json file so that it contains two configurations as shown in figures 13a and 13b.
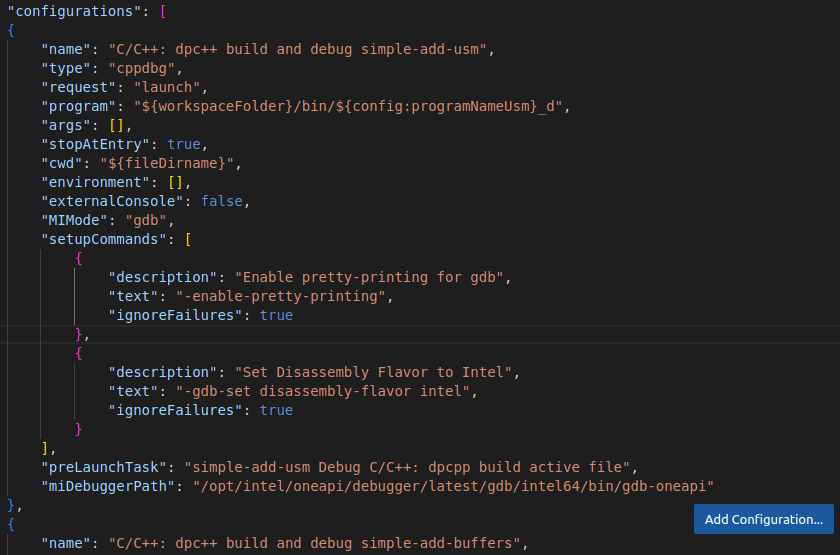
Figure 13a: Debug configuration for the simple-add-usm executable

Figure 13b: Debug configuration for the simple-add-buffers executable
Notable changes to the launch.json file are:
-
Changed the name of each of the configurations to be unique, i.e.
"name": "C/C++: dpc++ build and debug simple-add-usm". -
Used the same environmental variable substitution method as in the tasks.json file, i.e.
"program": "${workspaceFolder}/bin/${config:programNameUsm}_d". -
The prelaunchTask matches the equivalent label of the build configuration in the tasks.json file.
-
The miDebuggerPath points to the oneAPI debugger, i.e.
"miDebuggerPath": "/opt/intel/oneapi/debugger/latest/gdb/intel64/bin/gdb-oneapi".
To prevent a situation where a Visual Studio Code’s debug session can stall or hang, for example when stepping in or over a SYCL function like queue q(d_selector, dpc_common::exception_handler);, edit the launch.json file and add the following:
"setupCommands": [
{
  "description": "Needed by Intel oneAPI: Disable target async",
  "text": "set target-async off",
  "ignoreFailures": true
}]
A visual symptom of a hang is the interactive debug panel to run or step over into code looks ghosted out and non responsive. Generally, in this situation, the only option is to forcibly abort the debug session.
We are now at a stage where we can now choose the debug session to execute by going to the command palette and typing and selecting Debug: Select Session → Start a debug session → [choose one of the executables to debug]. This will now become the default debug session. Subsequent debug sessions can be had by using keyboard short cut (Fn+)F5 or using ctrl+shift+d. To select another executable to debug, choose Debug: Select Session again from the command palette.
Visual Studio Code can now debug DPC++ programs just like normal C++ programs by using the Visual Studio Code debug mode and debug execution panel.
Next steps
Guide 2 in this series Debugging the Intel DPC++ debugger using Visual Studio Code on Ubuntu will build on this guide and show you the IDE’s features that are available to you as you debug a DPC++ program and its kernels as they execute. The guide will show you how to visualize the program and the kernels’ changing state as you step through the code, set breakpoints as you go, view the content of variables and vitally see the memory of the output buffer update as each kernel runs.

Illya Rudkin
Principal Software Engineer
In This Series
This article is part of a series, please use links below to jump to different parts.
-
Guide 1Part 1Debugging SYCL™ code with DPC++ and Visual Studio® Code
-
Guide 1Part 2Setting up Visual Studio Code on Ubuntu for C++ development
-
Guide 1Part 3Setting up SYCL™ development with oneAPI™, DPC++ and Visual Studio® Code on Ubuntu
-
Guide 2Debugging the DPC++ debugger using Visual Studio® Code on Ubuntu
-
Guide 3Porting C++ projects to SYCL with DPC++ and Visual Studio Code
-
Guide 4Linking oneAPI libraries to a Visual Studio Code C++ Project