SYCL Performance Post: Choosing a Good Work Group Size for SYCL
09 January 2020
What is "work group" size in SYCL and how does it impact performance?
A "work group" is a 1, 2 or 3 dimensional set of threads within the thread hierarchy and contains a set of "work items," and each of these work items maps to a "core" in a GPU.
When using SYCL with an OpenCL device, the "work group" size often dictates the occupancy of the compute units. In order to achieve the best performance, we need to try to match the work group size to the size of the compute units on the hardware. Too large and the computations won't fit on the core, and too small the full capabilities of the core are not being used. Both of these scenarios are likely to reduce the performance of the code. Software can only achieve 100% utilization of an OpenCL device (e.g. a GPU) if it can fully occupy the hardware resources.
For an example showing how different work group sizes can affect the performance of SYCL code, take a look at pages 8 and 9 of this Argonne National Labs paper entitled "Improving the Performance of Medical Imaging Applications using SYCL."
Overview
The aim of this guide is to summarize and analyze the different techniques for deciding what work group size to use for optimal performance, and explain what needs to be considered when choosing an ideal work group size value.
The techniques covered in the guide are a summary of the most common ones used across the GPGPU industry, not just for SYCL.
So let's explore how to work out the most optimal work group size number so that our kernel performs at its best.
Finding the right values for the kernel execution range can take a bit of investigation. This is because there is really no "one size fits all" formula that, when applied, will let you figure out the best size of the work groups to launch a kernel with.
This value is uncovered with a bit of experimentation, using your algorithm alongside profiling and benchmarking to compile some execution numbers for comparison.
Fortunately, there are some guidelines to help steer your experimentation in the right direction, and we will bring together the most important ones related to SYCL and OpenCL. Remember that these guidelines are also relevant to GPGPU programming in general, not just for SYCL.
Initially, a good starting point is to rely on the OpenCL runtime implementation to select an optimal work group size for the kernel, and this default size usually provides acceptable performance, but most likely we can do better.
As already mentioned, the ideal solution would be to conduct a set of experiments using different work group sizes. This will uncover which sizes give the best performance for the kernel on the device you are running on. The real problem here however is that the ideal size of a work group is hardware dependent. So if you plan on supporting multiple devices you may need to write a function to accommodate this, one that chooses the appropriate work group size depending on the hardware being used.
Let the runtime decide the work group size for us
For some hardware, not specifying the work group size and letting the runtime choose the most appropriate value is often not much worse than the optimal size, and means running a set of experiments isn't needed.
Advantage of the default size
- Letting the OpenCL implementation automatically determine the optimal work group size for a kernel that only utilizes primary memory (
global memoryin OpenCL) is not uncommon and in many cases sufficient.
Disadvantage of the default size
-
This may not be ideal for kernels that make use of memory locality through cache memory ("
local memory"), which is also the fastest memory and used to temporarily store data for faster access.
Manually experimenting with the work group size
Recommendations
Reducing work group maintenance overhead
To reduce the overhead of maintaining a work group (switching), you should try and have work groups that are as large as possible, which means to have at least 32, but preferably more work items per work group, if possible. The number 32 can be used as a good naive starting point, but is unlikely to be the best size for you to use. From 32 now experiment with integer multiples of 32 for the work group size between 32 and the device_max_work_group_size. You will need to check what works best for your hardware vendor (e.g. AMD, Intel, ARM, etc.) and device type (e.g. CPU, GPU, FPGA, etc.).
If you want to be more precise with the starting number used to choose multiples from, query
kernel_preferred_work_group_size_multiple
using the following code snippet.
const size_t max_device_work_group_size = kernel.get_work_group_info<sycl::info::kernel_work_group::preferred_work_group_size_multiple>(device);Often a multiple of this number will turn out to be optimal for your device.
What that multiple is depends on the memory access pattern you use and the work load for each work item.
Some guidelines:
- If you are running a heavy, compute-bound kernel, try a smaller multiple.
- If you are bottlenecked by memory access, try a larger multiple to hide the memory latency.
- If you use live registers, the higher the register usage, the fewer threads you can run.
Profiling and Benchmarking
The first rule of improving the performance of any code is measuring what the time is being spent on. OpenCL vendors usually provide tools to measure how long each part of the code is taking. Codeplay has also implemented a built-in profiler for ComputeCpp, our SYCL implementation.
You can read more about SYCL profiling with ComputeCpp in the Optimizing Your SYCL Code Using Profiling blog post. It covers how to create custom timers to profile execution times as well as how to use the automated profiling feature in the ComputeCpp Professional Edition. This is an integrated JSON profiler that records the execution times and memory bandwidth, in addition to many other features that can help you uncover bottlenecks.
Considerations
Additionally, the ability to execute work groups concurrently can also be affected by the following key factors:
-
Kernel branching that can lead to a necessary use of work-group synchronization via barriers.
- Barriers literally impose an execution roadblock as all threads are required to reach the barrier before any thread can continue.
- The amount of shared local memory available per compute unit.
- Each work group can allocate a certain amount of memory strictly for itself.
Note, however, that if it does allocate the maximum, this may prevent the scheduling of other workgrups concurrently on the same compute unit.
- Each work group can allocate a certain amount of memory strictly for itself.
Device Cache
In order to keep device utilization high with the limited number of work groups, larger (power-of-two) work group sizes are required. The power of two is needed as the local work size must be a division of the global work size. However, the size of the accessed data set is an upper bound here. This means it is best not to exceed the size of the L1 cache in a single work group for most optimal data access between threads.
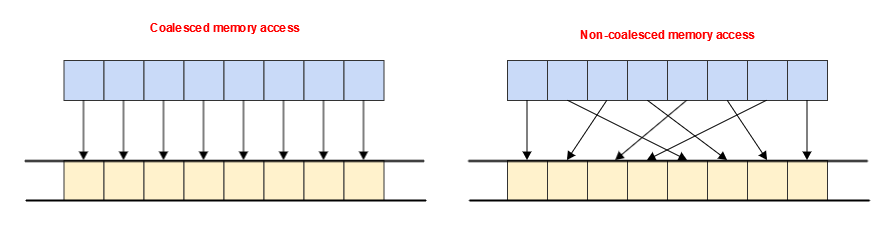
If a set of work items in a work group perform simultaneous execution of an instruction that accesses memory, it is important to consider the access pattern created by the underlying threads in that group.
For example, when loading data through the L1 cache, an entire 64-byte cache line might be fetched, regardless of whether we are using the least efficient pattern (where one thread is reading one value), or if we are using the most efficient pattern (where all 16 threads are reading consecutive 4-byte values). See examples of these patterns in the images below.
You can query the value of a device's cache line size through device_global_mem_cacheline_size and use this value to specify an optimal work group size for the specific hardware.
The ability to run a particular group of work items - a "sub-slice" from a whole work group "slice" simultaneously using a SIMD approach is not guaranteed in the specification so this is a consideration based on the way each device implements OpenCL. Intel's SoC (System on a Chip) hardware are designed for this kind of optimization, therefore it can come undoubtedly come in handy when running on their GPUs.
Synchronization
Another consideration is the synchronization between work items in a work group if you know you will need to synchronize work items in this work group.
Assuming you are keeping logical branches inside your kernel code to an absolute minimum (ideally, none) the kernel will take the same time to execute for each compute unit (a compute unit executes a work group).
You can try and calculate the work group size based on the number of compute units that your OpenCL device has.
To do that, you can query the value of device_max_compute_units and use it to calculate the work group size. Assuming the OpenCL implementation you are running on is conformant with the specification, the value returned from this query will give the minimum number of work groups to fully utilize the device. Now, the number of compute units is a hint at the minimum number of work groups you should run to fully use the device, so if you devide the total number of work items to be executed by that queried number of compute units for your OpenCL device you will get a decent approximation for a potentially optimal work group size.
In practice, especially on GPUs, you will typically want to have more work groups per compute unit, but it is a viable method to select a work group size to utilize a GPU device. This assumes your kernels have (ideally) branch-less logic and involve synchronization.
Summary
Overall, if your intention is to assign work items in a hardware independent way, leaving the work group size unspecified on the user side could be a solution that yields good results. It is not guaranteed to be the most optimal, but if you haven't experimented with multiples of kernel_preferred_work_group_size_multiple, or your kernel is not necessarily designed for a particular group size, this is a good default option to rely on.
If not, make sure you take into consideration the hardware architecture as well as the design of your kernels, which involves work item memory access patterns and the workloads.
You should also use profiling to determine if the workloads are compute-bound or memory-bound, this will tell you what you might need to change to improve the performance of your code.
Ultimately, determining when your access time and your compute time are optimal is the key, and don't forget to benchmark the execution times and the memory bandwidth, then store the data for comparison and analysis.
Glossary
- "compute unit" A processor unit.
- "global memory" Global memory represents allocations from a pool of memory visible by all threads of the device.
- "local memory" Local memory is a contiguous region of memory allocated per work group, and visible to all work items within that work group.
- "work group" A work group is a 1, 2 or 3 dimensional set of threads within the thread hierarchy. In SYCL, the only synchronization that is possible is across all work items within a work group using barriers.
- "work item" A work item is a single thread within the thread hierarchy.
Reference: Optimizing Your SYCL Code Using Profiling